CAGE - What can it do for you?

  • Highly sensitive and accurate quantitative transcriptome analysis not only as a gene, but as a Transcription Start Site (TSS).
  • Reliable way to discover Transcription Factor binding motif based on the true TSS nearby the actual promoter.
  • Unique and powerful tool to discover alternative promoters for all endogenous genes.
  • Help you to discover new biomarker and/or bidirectional enhancer RNA.
  • Clarifying the heterogeneity and complexity of transcriptomes from the view of Cause of Transcription instead of expression profiling.
  • Linking expression values to promoter sites for a better understanding of how signaling pathways regulate transcription.
  • PCR-free operation procedures provide unbiased quantification of transcript amount.

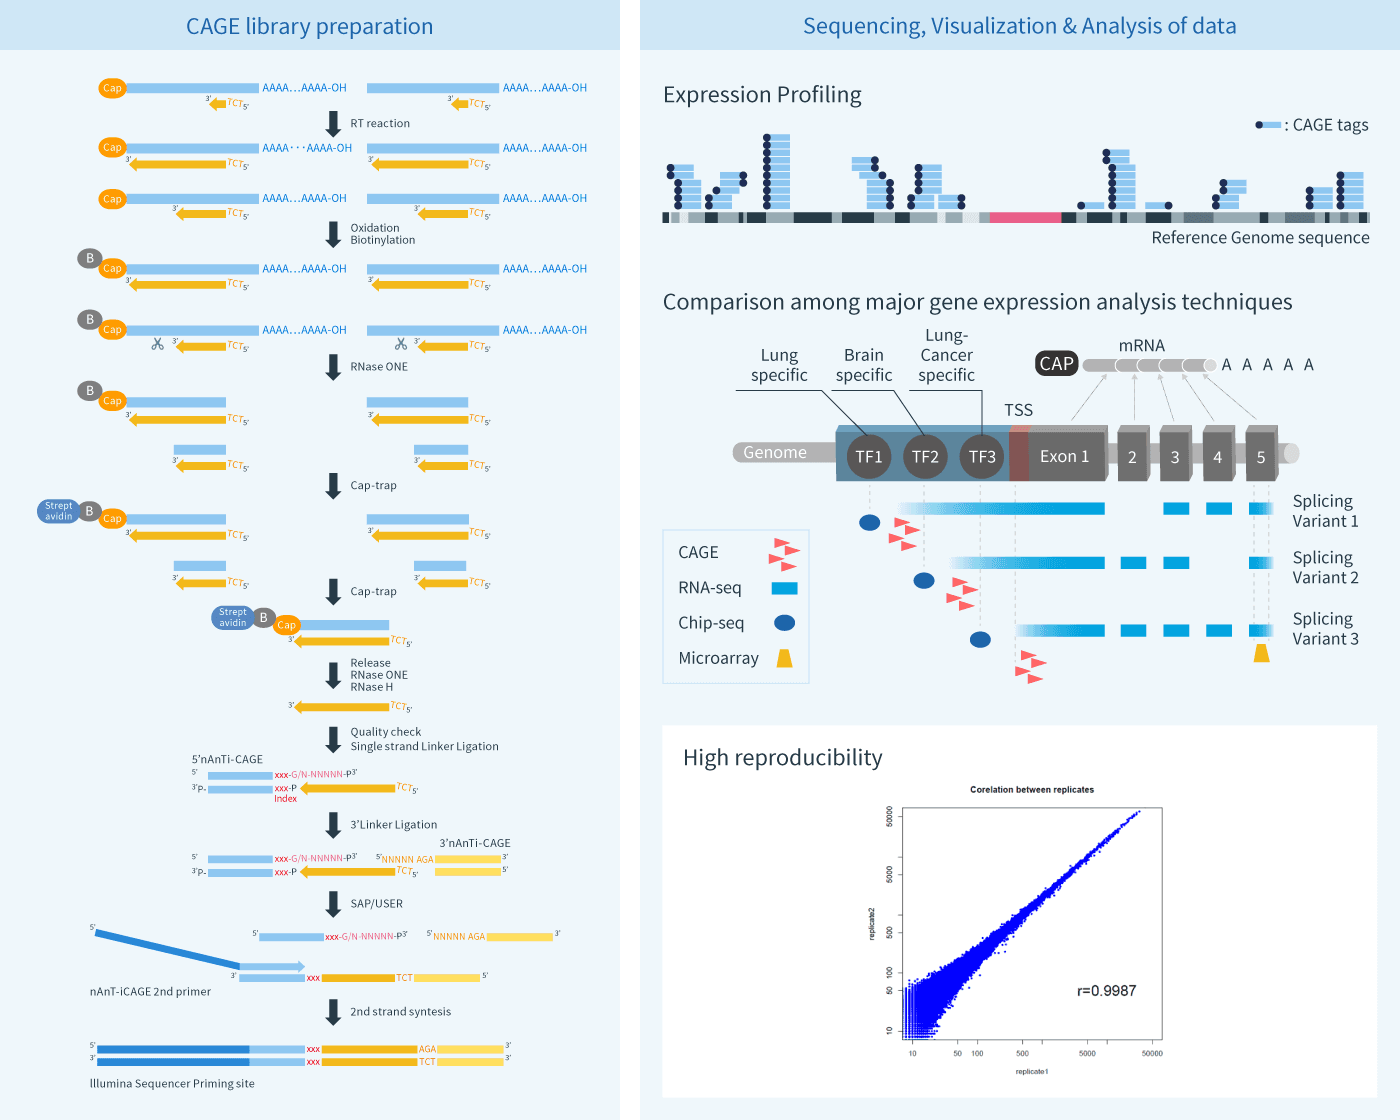
Difference from RNA-Seq and other gene expression analysis techniques

Different from Microarray and RNA-seq, CAGE is able to accurately identify transcriptional start sites (TSSs) and the corresponding promoter regions through sequencing the 3’ end of cDNA (5’ end of RNA). This makes CAGE a powerful tool to analyze the gene regulation in the TSSs level, enabling analysis of the gene regulated by multiple alternative promoters. Therefore, CAGE can serve as a new perspective approach for genome annotation, by elucidating transcriptional signaling cascades, and performing other functions.

Comparison among major gene expression analysis techniques
CAGE RNA-seq SAGE Microarray
de novo Gene Finding good good good N/A
Gene Expression Quantification superior*1 1
*1 free of PCR bias unaffected by gene size
good good average
Determining Promoter Site superior average N/A N/A
Motif Finding for Transcription Factor Binding Site superior average average*2 2
*2 depending on known 5' end sequence information
average*3 2
*3 depending on known 5' end sequence information
Identification of Bidirectional Enhancer RNA superior N/A N/A N/A
Determining Transcription Start/1st Exon Site superior average N/A N/A
Determining Gene Structure (intron/exon, alternative splicing variants) N/A average*43
*4 depending on sequence depth
N/A N/A
Duration of Work Process average average average good
Library Preparation Complicatedness Long Time 4 (8 days) average average easy
Data Analysis Tools average good average good

("N/A" means not applicable)

  • 1 free of PCR bias and unaffected by gene size
  • 2 depending on known 5' end sequence information
  • 3 depending on sequence depth
  • 4 8 days

What is the CAGE method?

Cap Analysis of Gene Expression (CAGE) is a method for promoter identification and transcription profiling developed by RIKEN (Patent Number: US 6174669, US 6221599, US8809518, etc.). CAGE utilizes a “cap-trapping” technology based on the biotinylation of the 7-methylguanosine cap of Pol II transcripts, to pull down the 5’-complete cDNAs reversely transcribed from the captured transcripts. Through a massive parallel sequencing of the 5’ end of cDNA and analysis of the sequenced tags, transcription start sites and transcripts amount are inferred on a genome-wide scale. Thus, CAGE provides an effective genome-wide transcriptional profiling as an alternative to microarray and RNA-seq.
We are offering CAGE library preparation service with or without sequencing & basic bioinformatics analysis.

Item Specification Comment
Total RNA required 3 μg of total RNA/sample for PCR free CAGE library If possible, please provide 12μg of total RNA for PCR free CAGE library preparation service.
CAGE library can be prepared from few 100ng of total RNA, by adding PCR amplification.
RNA entry QC Bioanalyzer We perform entry QC on all samples.
DNA amount of CAGE library Several ng DNA fragments ready for illumine NGS sequencer.
Sequencing platform Illumina NextSeq 500
Number of reads per sample guaranteed 15M reads/sample
Optional extra sequencing Number of lanes per sample Additional reads are available with additional charge.
Mapping rate About 75% of tags map to unique mapping position 4 M mappable CAGE tags / sample is guaranteed.
Sequence data Provided with Illumina file format Delimited text files holding sequence information and quality scores.
Data Analysis Mapping positions, Read count quantification, CTSS clustering, Differential expression analysis, Gene Ontology enrichment analysis and Transcriptional Factor binding motif search Tables/flat files: number of raw reads, number of extracted tags, number of mapped tags, etc.

Sample Data Download

Downlod the raw fastq data, processed fastq data, reference genome, and analysis results
* The file may take some time to download as the total data size is 32.6GB.
Download

How does CAGE work?

First strand cDNA synthesis is performed using our proprietarily owned technology facilitating thermostable reverse transcription and random priming. Random Priming allows for the finding of non-polyadenylated RNA as well. RNAs without the 5’-cap such as rRNA, truncated RNA, and incompletely reversely transcribed RNAs are eliminated by cap-trapping.

After selection of full-length cDNA, adaptors are ligated to the 5'-ends of full-length enriched cDNAs as well as the 3'-ends in the strand-specific manner. CAGE Tags are ready for high-throughput sequencing after the 2nd strand synthesis.

CAGE tags are mapped to the reference genome to identify TSS and their related promoter regions. In addition, comparison of mapping positions to defined transcripts provides an annotation of the CAGE tag. The number of CAGE tags mapped at specific locations in the genome provides quantification on promoter activities on a genome-wide scale.

Hence, CAGE can contribute to projects in Genome Annotation, Gene Discovery, Gene Expression Profiling, and Promoter Identification. The Reference List showed examples on how CAGE has been successfully used in studies related to transcriptome analysis and promoter identification. Our CAGE protocols are based on a well-established procedure capable of obtaining a large number of tags.

Why we can trust the CAGE analysis?

Extensively used within the

User voices

Shipping and Packing

No charge for shipping within Japan.
Shipping outside Japan, extra fee will be charged. Please refer our Shipping, Packing Charge Information

Shipping and Packing Charge
The library will be shipped at RT as dried pellet.


References

CAGE methods

  1. NET-CAGE characterizes the dynamics and topology of human transcribed cis-regulatory elements. Hirabayashi S et al, Nat Genet. 2019; 51(9), 1369-1379.
  2. CAGEr: precise TSS data retrieval and high-resolution promoterome mining for integrative analyses. Haberle V et al, Nucleic Acids Res. 2015; 43(8), e51.
  3. RECLU: a pipeline to discover reproducible transcriptional start sites and their alternative regulation using capped analysis of gene expression (CAGE). Ohmiya H et al, BMC Genomics. 2014; 15, 269.
  4. Detecting expressed genes using CAGE. Murata M et al, Methods Mol Biol. 2014; 1164, 67-85.

Selected papers for non-human, non-mouse organisms using CAGE

Mammals

Other vertebrates

Invertebrates

Plants

Fungi

Viruses


List of papers using the CAGE
View All
Close

2022

  1. Cap analysis of gene expression reveals alternative promoter usage in a rat model of hypertension. Dahale S et al, Life Sci Alliance. 2022-04 Apr; 5(4):e202101234.
  2. Insights regarding sirtuin-dependent gene regulation during white koji production. Futagami T et al, Commun Integr Biol. 2022-12-31 Dec; (1)15:92-95.
  3. Suppression of human trophoblast syncytialization by human cytomegalovirus infection. Mimura N et al, Placenta. 2022; 117, 200-208.
  4.     and more

2021

  1. Genome wide analysis of bovine enhancers and promoters across developmental stages in liver. Forutan M et al, Proc Assoc Advmt Anim Breed Genet. 2021; 24, 126-130.
  2. Integration of Single-Cell RNA- and CAGE-seq Reveals Tooth-Enriched Genes. Chiba Y et al, J Dent Res. 2021; 220345211049785.
  3. CAGE-Seq Reveals that HIV-1 Latent Infection Does Not Trigger Unique Cellular Responses in a Jurkat T Cell Model. Matsui H et al, J Virol. 2021; 95(8), e02394-20.
  4.     and more

  5. Single-molecule long-read sequencing reveals a conserved intact long RNA profile in sperm. Sun Y et al, Nat Commun. 2021; 12(1), 1361.
  6. FANTOM enters 20th year: expansion of transcriptomic atlases and functional annotation of non-coding RNAs. Abugessaisa I et al, Nucleic Acids Res. 2021; 49(D1), D892-D898.
  7. IL-4i1 Regulation of Immune Protection During Mycobacterium tuberculosis Infection. Hlaka L et al, J Infect Dis. 2021; 224, 2170-2180.
  8. Spontaneous pulmonary emphysema in mice lacking all three nitric oxide synthase isoforms. Kato K et al, Sci Rep. 2021; 11(1), 22088.
  9. Integrative transcription start site analysis and physiological phenotyping reveal torpor-specific expression program in mouse skeletal muscle. Deviatiiarov R et al, Commun Biol. 2021; 4(1), 1290.
  10. Runt-related transcription factor-2 (Runx2) is required for bone matrix protein gene expression in committed osteoblasts in mice. Qin X et al, J Bone Miner Res. 2021; 36(10), 2081-2095.
  11. The choice of negative control antisense oligonucleotides dramatically impacts downstream analysis depending on the cellular background. Ducoli L et al, BMC Genom Data. 2021; 22(1), 33.
  12. Spatial mapping reveals human adipocyte subpopulations with distinct sensitivities to insulin. Bäckdahl J et al, Cell Metab. 2021; 33(9), 1869-1882.e6.
  13. Transcription start site‐level expression of thyroid transcription factor 1 isoforms in lung adenocarcinoma and its clinicopathological significance. Sano K et al, J Pathol: Clin Res. 2021; 7(4), 361-374.
  14. Genome-Wide Atlas of Promoter Expression Reveals Contribution of Transcribed Regulatory Elements to Genetic Control of Disuse-Mediated Atrophy of Skeletal Muscle. Pintus S et al, Biology. 2021; 10(6), 557.
  15. WWOX Loses the Ability to Regulate Oncogenic AP-2γ and Synergizes with Tumor Suppressor AP-2α in High-Grade Bladder Cancer. Kołat D et al, Cancers. 2021; 13(12), 2957.
  16. Evolution of tissue and developmental specificity of transcription start sites in Bos taurus indicus. Forutan M et al, Commun Biol. 2021; 4(1), 829.
  17. Both murine and human sperm contain intact large RNAs. Wang Z et al, Biol Reprod. 2021; 104(6), 1184-1186.
  18. Genome-Wide Role of HSF1 in Transcriptional Regulation of Desiccation Tolerance in the Anhydrobiotic Cell Line, Pv11. Tokumoto S et al, Int J Mol Sci. 2021; 22(11), 5798.
  19. Titanium nanoparticles potentially affect gingival tissue through IL-13α2 receptor expression. Ishikawa T et al, J Oral Sci. 2021; 63(3), 263-266.
  20. eNEMAL, an enhancer RNA transcribed from a distal MALAT1 enhancer, promotes NEAT1 long isoform expression. Stone J et al, PLoS One. 2021; 16(5), e0251515.
  21. Development of p53 knockout U87MG cell line for unbiased drug delivery testing system using CRISPR-Cas9 and transcriptomic analysis. Kwon A et al, J Biotech. 2021; 332, 72-82.
  22. Identification of candidate PAX2-regulated genes implicated in human kidney development. Yamamura Y et al, Sci Rep. 2021; 11(1), 9123.
  23. Human White Adipose Tissue Displays Selective Insulin Resistance in the Obese State. Mileti E et al, Diabetes. 2021; 70(7), 1486-1497.
  24. Cancer‐associated fibroblast migration in non‐small cell lung cancers is modulated by increased integrin α11 expression. Iwai M et al, Mol Oncol. 2021; 15(5), 1507-1527.
  25. Conophylline inhibits hepatocellular carcinoma by inhibiting activated cancer-associated fibroblasts through suppression of G Protein-Coupled Receptor 68. Yamanaka T et al, Mol Cancer Ther. 2021; 20(6), 1019-1028.
  26. Global patterns of enhancer activity during sea urchin embryogenesis assessed by eRNA profiling. Khor J et al, Genome Res. 2021; 31(9), 1680-1692.
2020

  1. TBPL2/TFIIA complex establishes the maternal transcriptome through oocyte-specific promoter usage. Yu C et al, Nat Commun. 2020; 11(1), 6439.
  2. Use of Cap Analysis Gene Expression to detect human papillomavirus promoter activity patterns at different disease stages. Taguch A et al, scientific reports. 2020; 10(1), 17991.
  3. Hybrid Gene Origination Creates Human-Virus Chimeric Proteins during Infection. Ho J et al, Cell. 2020; 181(7), 1502-1517. E23.
  4.     and more

  5. Cap Analysis of Gene Expression (CAGE): A Quantitative and Genome-Wide Assay of Transcription Start Sites. Morioka M et al, Bioinformatics for Cancer Immunotherapy: Methods and Protocols. 2020; 277-301.
  6. Recounting the FANTOM CAGE-Associated Transcriptome. Imada E et al, Genome Res. 2020; 30(7), 1073-1081.
  7. Distinct roles of nucleosome sliding and histone modifications in controlling the fidelity of transcription initiation. Zhang H et al, RNA Biol. 2020; 18(11), 1642-1652.
  8. Heat shock induces the nuclear accumulation of YAP1 via SRC. Jiang X et al, Exp Cell Res. 2020; 399(1), 112439.
  9. A Synthetic Strong and Constitutive Promoter Derived from the Stellaria media pro-SmAMP1 and pro-SmAMP2 Promoters for Effective Transgene Expression in Plants. Efremova L et al, Genes. 2020; 11(12), 1407.
  10. Deep phenotyping of myalgic encephalomyelitis/chronic fatigue syndrome in Japanese population. Kitami T et al, Sci Rep. 2020; 10(1), 19933.
  11. The PWWP2A Histone Deacetylase Complex Represses Intragenic Spurious Transcription Initiation in mESCs. Wei G et al, iScience. 2020; 23(11), 101741.
  12. Global Analysis of Transcription Start Sites in the New Ovine Reference Genome (Oar rambouillet v1.0). Salavati M et al, Front Genet. 2020; 11, 580580.
  13. Long Non-coding RNAs Diversity in Form and Function: From Microbes to Humans. Toomer G et al, The Chemical Biology of Long Noncoding RNAs. 2020; 1-57.
  14. Experimental glioma with high bHLH expression harbor increased replicative stress and are sensitive toward ATR inhibition. Koch M et al, Neuro-oncol adv. 2020; 2(1), vdaa115.
  15. Altered Enhancer and Promoter Usage Leads to Differential Gene Expression in the Normal and Failed Human Heart. Gacita A et al, Circ Heart Fail. 2020; 13(10), 467-480.
  16. Circadian clock mechanism driving mammalian photoperiodism. Wood S et al, Nat Commun. 2020; 11(1), 1-15.
  17. CAGE-seq analysis of osteoblast derived from cleidocranial dysplasia human induced pluripotent stem cells. Ooki A et al, Bone. 2020; 141, 115582.
  18. Amplification of autocrine motility factor and its receptor in multiple myeloma and other musculoskeletal tumors. Nakajima K, Raz A A, J Bone Oncol. 2020; 23, 100308.
  19. Pharmacologically targetable vulnerability in prostate cancer carrying RB1-SUCLA2 deletion. Kohno S et al, Oncogene. 2020; 39(34), 5690-5707.
  20. Functional annotation of human long noncoding RNAs via molecular phenotyping. Ramilowski J et al, Genome Res. 2020; 30(7), 1060-1072.
  21. The RNA exosome shapes the expression of key protein-coding genes. Wu M et al, Nucleic Acids Res. 2020; 48(15), 8509-8528.
  22. The Transcriptional Network That Controls Growth Arrest and Macrophage Differentiation in the Human Myeloid Leukemia Cell Line THP-1. Gažová I et al, Front Cell Dev Biol. 2020; 8, 498.
  23. Embryonic tissue differentiation is characterized by transitions in cell cycle dynamic-associated core promoter regulation. Wragg J et al, Nucleic Acids Res. 2020; 48(15), 8374-8392.
  24. The Human Integrator Complex Facilitates Transcriptional Elongation by Endonucleolytic Cleavage of Nascent Transcripts. Beckedorff F et al, Cell Rep. 2020; 32(3), 107917.
  25. Mac-2-binding protein glycan isomer enhances the aggressiveness of hepatocellular carcinoma by activating mTOR signaling. Dolgormaa G et al, Br J Cancer. 2020; 123(7), 1145-1153.
  26. Widespread conservation and lineage-specific diversification of genome-wide DNA methylation patterns across arthropods. Lewis S et al, PLoS Genet. 2020; 16(6), e1008864.
  27. Epigenetic regulation of spurious transcription initiation in Arabidopsis. Le N et al, Nat Commun. 2020; 11(1), 3224.
  28. Comprehensive Characterization of Transcriptional Activity during Influenza A Virus Infection Reveals Biases in Cap-Snatching of Host RNA Sequences. Clohisey S et al, J Virol. 2020; 94(10), e01720-19.
  29. The African Swine Fever Virus Transcriptome. Cackett G et al, J Virol. 2020; 94(9), e00119-20.
  30. Sirtuin SirD is involved in α-amylase activity and citric acid production in Aspergillus luchuensis mut. kawachii during a solid-state fermentation process. Miyamoto A et al, ‎J Biosci Bioeng. 2020; 129(4), 454-466.
  31. Characterization of Arabidopsis thaliana Promoter Bidirectionality and Antisense RNAs by Inactivation of Nuclear RNA Decay Pathways. Thieffry A et al, Plant Cell. 2020; 32(6), 1845-1867.
  32. Promoter-Level Transcriptome Identifies Stemness Associated With Relatively High Proliferation in Pancreatic Cancer Cells. Chen R et al, Front Oncol. 2020; 10, 316.
  33. PD-1 imposes qualitative control of cellular transcriptomes in response to T cell activation. Shimizu K et al, Mol Cell. 2020; 77(5), 937-950.e6.
  34. microRNA-875-5p plays critical role for mesenchymal condensation in epithelial-mesenchymal interaction during tooth development. Funada K et al, Sci Rep. 2020; 10(1), 4918.
  35. PLAG1 enhances the stemness profiles of acinar cells in normal human salivary glands in a cell type-specific manner. Goto Y et al, J Oral Biosci. 2020; 62(1), 99-106.
  36. RADICL-seq identifies general and cell type–specific principles of genome-wide RNA-chromatin interactions. Bonetti A et al, Nat Commun. 2020; 11(1), 1-14.
  37. Belinostat resolves skin barrier defects in atopic dermatitis by targeting the dysregulated miR-335: SOX6 axis. Liew W et al, J Allergy Clin Immunol. 2020; 146(3), 606-620.e12.
  38. Metabolite/phytohormone–gene regulatory networks in soybean organs under dehydration conditions revealed by integration analysis. Maruyama K et al, Plant J. 2020; 103(1), 197-211.
  39. LaeA controls citric acid production through regulation of the citrate exporter-encoding cexA gene in Aspergillus luchuensis mut. kawachii. Kadooka C et al, Appl Environ Microbiol. 2020; 86(5), e01950-19.
  40. Chromatin Organization in Early Land Plants Reveals an Ancestral Association between H3K27me3, Transposons, and Constitutive Heterochromatin. Montgomery S et al, Curr Biol. 2020; 30(4), 573-588.e7.
  41. Dual role of Jam3b in early hematopoietic and vascular development. Kobayashi I et al, Development. 2020; 147(1), dev181040.
  42. Expression of a Constitutively Active Form of Hck in Chondrocytes Activates Wnt and Hedgehog Signaling Pathways, and Induces Chondrocyte Proliferation in Mice. Matsuura V et al, Int J Mol Sci. 2020; 21(8), 2682.
  43. Dual-initiation promoters with intertwined canonical and TCT/TOP transcription start sites diversify transcript processing. Nepal C et al, Nat Commun. 2020; 11(1), 168.
  44. Developmental regulation of cell type-specific transcription by novel promoter-proximal sequence elements. Lu D et al, Genes Dev. 2020; 34(9-10), 663-677.
  45. Genome-Wide Analysis of Transcription Start Sites and Core Promoter Elements in Hevea brasiliensis. Makita Y et al, The Rubbe Tree Genome. 2020; 81-91.
2019

  1. NET-CAGE characterizes the dynamics and topology of human transcribed cis-regulatory elements. Hirabayashi S et al, Nat Genet. 2019; 51(9), 1369-1379.
  2. Identification of novel cerebellar developmental transcriptional regulators with motif activity analysis. Ha T J et al, BMC Genomics. 2019; 20(1), 718.
  3. CXCL4/PF4 is a predictive biomarker of cardiac differentiation potential of human induced pluripotent stem cells. Ohashi F et al, Sci Rep. 2019; 9(1), 4638.
  4.     and more

  5. Transcription Start Site Mapping Using Super-low Input Carrier-CAGE. Cvetesic N et al, J Vis Exp. 2019; (148), e59805.
  6. Mesenchymal stem cells cultured under hypoxic conditions had a greater therapeutic effect on mice with liver cirrhosis compared to those cultured under normal oxygen conditions. Kojima Y et al, Regen Ther. 2019; 11, 269-281.
  7. HTLV-1 contains a high CG dinucleotide content and is susceptible to the host antiviral protein ZAP. Miyazato P et al, Retrovirology. 2019; 16(1), 38.
  8. CAGEfightR: analysis of 5'-end data using R/Bioconductor. Thodberg M et al, BMC Bioinformatics. 2019; 20(1), 487.
  9. The WWOX Gene Influences Cellular Pathways in the Neuronal Differentiation of Human Neural Front Cell. Kośla K et al, Front Cell Neurosci. 2019; 13, 391.
  10. An impaired intrinsic microglial clock system induces neuroinflammatory alterations in the early stage of amyloid precursor protein knock-in mouse brain. Ni J et al, J Neuroinflammation. 2019; 16(1), 173.
  11. Alternative polyadenylation coordinates embryonic development, sexual dimorphism and longitudinal growth in Xenopus tropicalis. Zhou X et al, Cell Mol Life Sci. 2019; 76(11), 2185-2198.
  12. A step-by-step guide to analyzing CAGE data using R/Bioconductor. Thodberg M et al, F1000Res. 2019; 8, 886.
  13. Pervasive and dynamic transcription initiation in Saccharomyces cerevisiae. Lu Z, Lin Z Z, Genome Res. 2019; 29(7), 1198-1210.
  14. Identification of hypothalamic genes in associating with food intake during incubation behavior in domestic chicken. Takeda M et al, Anim Sci J. 2019; 90(9), 1293-1302.
  15. Genome-wide Transcript Structure Resolution Reveals Abundant Alternate Isoform Usage from Murine Gammaherpesvirus 68. O’Grady T et al, Cell Rep. 2019; 27(13), 3988-4002.e5.
  16. Intra- and interspecies comparison of EYS transcripts highlights its characteristics in the eye. Takita S et al, FASEB J. 2019; 33(8), 9422-9433.
  17. Targeted, High-Resolution RNA Sequencing of Non-coding Genomic Regions Associated With Neuropsychiatric Functions. Hardwick SA et al, Front Genet. 2019; 10, 309.
  18. Multi-year whole-blood transcriptome data for the study of onset and progression of Parkinson's Disease. Valentine MNZ et al, Sci Data. 2019; 6(1), 20.
  19. Specific Features of Fibrotic Lung Fibroblasts Highly Sensitive to Fibrotic Processes Mediated via TGF-β-ERK5 Interaction. Kadoya K et al, Cell Physiol Biochem. 2019; 52(4), 822-837.
  20. Antisense Transcription in Loci Associated to Hereditary Neurodegenerative Diseases. Zucchelli et al, Mol Neurobiol. 2019; 56, 5392-5415.
  21. Comprehensive analysis of chromatin signature and transcriptome uncovers functional lncRNAs expressed in nephron progenitor cells. Nishikawa M et al, Biochim Biophys Acta Gene Regul Mech. 2019; 1862(1), 58-70.
  22. YeasTSS: an integrative web database of yeast transcription start sites. McMillan J et al, Database. 2019; baz048.
2018

  1. Promoter Usage and Dynamics in Vascular Smooth Muscle Cells Exposed to Fibroblast Growth Factor-2 or Interleukin-1β. Alhendi AMN et al, Sci Rep. 2018; 8(1), 13164.
  2. Genome-Wide TSS Identification in Maize. Mejia-Guerra MK et al, Methods Mol Biol. 2018; 1830, 239-256.
  3. Alternative start and termination sites of transcription drive most transcript isoform differences across human tissues. Reyes A et al, Nucleic Acids Res. 2018; 46(2), 582-592.
  4.     and more

  5. SLIC-CAGE: high-resolution transcription start site mapping using nanogram-levels of total RNA. Cvetesic N et al, Genome Res. 2018; 28(12), 1943-1956.
  6. Update of the FANTOM web resource: expansion to provide additional transcriptome atlases. Lizio M et al, Nucleic Acids Res. 2018; 47(Database issue), D752-D758.
  7. NanoCAGE-XL: An Approach to High-Confidence Transcription Start Site Sequencing. Ivanchenko MG et al, Methods Mol Biol. 2018; 1830, 225-237.
  8. Comprehensive comparative analysis of 5'-end RNA-sequencing methods. Adiconis X et al, Nat Methods. 2018; 15(7), 505-511.
  9. Saccharomyces cerevisiae displays a stable transcription start site landscape in multiple conditions. Börlin CS et al, FEMS Yeast Res. 2018; 19(2), foy128.
  10. Comprehensive profiling of the fission yeast transcription start site activity during stress and media response. Thodberg M et al, Nucleic Acids Res. 2018; 47(4), 1671-1691.
  11. Integration of genetics and miRNA-target gene network identified disease biology implicated in tissue specificity. Sakaue S et al, Nucleic Acids Res. 2018; 46(22), 11898-11909.
  12. Conserved temporal ordering of promoter activation implicates common mechanisms governing the immediate early response across cell types and stimuli. Vacca A et al, Open Biol. 2018; 8(8), 180011.
  13. CAGE-seq analysis of Epstein-Barr virus lytic gene transcription: 3 kinetic classes from 2 mechanisms. Djavadian R et al, PLoS Pathog. 2018; 14(6), e1007114.
  14. Transcriptional landscape of Mycobacterium tuberculosis infection in macrophages. Roy S et al, Sci Rep. 2018; 8(1), 6758.
  15. Roles of Enhancer RNAs in RANKL-induced Osteoclast Differentiation Identified by Genome-wide Cap-analysis of Gene Expression using CRISPR/Cas9. Sakaguchi Y et al, Sci Rep. 2018; 8(1), 7504.
  16. Characterization of the human RFX transcription factor family by regulatory and target geneanalysis. Sugiaman-Trapman D et al, BMC Genomics. 2018; 19(1), 181.
  17. Shared activity patterns arising at genetic susceptibility loci reveal underlying genomic and cellular architecture of human disease. Baillie JK et al, PLoS Comput Biol. 2018; 14(3), e1005934.
  18. Distinct core promoter codes drive transcription initiation at key developmental transitions in a marine chordate. Danks GB,et al, BMC Genomics. 2018; 19(1), 164.
  19. Correction to: Relatively frequent switching of transcription start sites during cerebellar development. Zhang P et al, BMC Genomics. 2018; 19(1), 39.
  20. TBX4 is involved in the super-enhancer-driven transcriptional programs underlying features specific to lung fibroblasts. Horie M et al, Am J Physiol Lung Cell Mol Physiol. 2018; 314(1), L177-L191.
  21. Reactivation of endogenous retroviral elements via treatment with DNMT- and HDAC-inhibitors. Daskalakis M et al, Cell Cycle. 2018; 17(7), 811-822.
2017

  1. An atlas of human long non-coding RNAs with accurate 5' ends. Hon CC et al, Nature. 2017; 543(7644), 199-204.
  2. Transcription start site profiling of 15 anatomical regions of the Macaca mulatta central nervous system. Francescatto M et al, Sci Data. 2017; 4, 170163.
  3. Promoter-level transcriptome in primary lesions of endometrial cancer identified biomarkers associated with lymph node metastasis. Yoshida E et al, Sci Rep. 2017; 7(1), 14160.
  4.     and more

  5. Linking FANTOM5 CAGE peaks to annotations with CAGEscan. Bertin N,et al, Sci Data. 2017; 4, 170147.
  6. The FANTOM5 collection, a data series underpinning mammalian transcriptome atlases in diverse cell types. Kawaji H et al, Sci Data. 2017; 4, 170113.
  7. FANTOM5 CAGE profiles of human and mouse reprocessed for GRCh38 and GRCm38 genome assemblies. Abugessaisa I et al, Sci Data. 2017; 4, 170107.
  8. FANTOM5 CAGE profiles of human and mouse samples. Noguchi S et al, Sci Data. 2017; 4, 170112.
  9. TSS-Seq analysis of low pH-induced gene expression in intercalated cells in the renal collecting duct. Izumi Y et al, PLoS One. 2017; 12(8), e0184185.
  10. The FANTOM5 Computation Ecosystem: Genomic Information Hub for Promoters and Active Enhancers. Abugessaisa I et al, Methods Mol Biol. 2017; 1611, 199-217.
  11. Deep Cap Analysis of Gene Expression (CAGE): Genome-Wide Identification of Promoters, Quantification of Their Activity, and Transcriptional Network Inference. Fort A et al, Methods Mol Biol. 2017; 1543, 111-126.
  12. NanoCAGE: A Method for the Analysis of Coding and Noncoding 5'-Capped Transcriptomes. Poulain S et al, Methods Mol Biol. 2017; 1543, 57-109.
  13. Monitoring transcription initiation activities in rat and dog. Lizio M et al, Sci Data. 2017; 4, 170173.
  14. Restricted Presence of POU6F2 in Human Corneal Endothelial Cells Uncovered by Extension of the Promoter-level Expression Atlas. Yoshihara M et al, EBioMedicine. 2017; 25, 175-186.
  15. Genome-wide profiling of transcribed enhancers during macrophage activation. Denisenko E et al, Epigenetics Chromatin. 2017; 10(1), 50.
  16. Arabidopsis thaliana cold-regulated 47 gene 5'-untranslated region enables stable high-level expression of transgenes. Yamasaki S et al, J Biosci Bioeng. 2017; 125(1), 124-130.
  17. Systematic analysis of transcription start sites in avian development. Lizio M et al, PLoS Biol. 2017; 15(9), e2002887.
  18. An integrated expression atlas of miRNAs and their promoters in human and mouse. de Rie D et al, Nat Biotechnol. 2017; 35(9), 872-878.
  19. Annotation and cluster analysis of spatiotemporal- and sex-related lncRNA expression in rhesus macaque brain. Liu S et al, Genome Res. 2017; 27(9), 1608-1620.
  20. Application of a CAGE Method to an Avian Development Study. Deviatiiarov R et al, Methods Mol Biol. 2017; 1650, 101-109.
  21. High-resolution promoter map of human limbal epithelial cells cultured with keratinocyte growth factor and rho kinase inhibitor. Yoshihara M et al, Sci Rep. 2017; 7(1), 2845.
  22. A high-quality annotated transcriptome of swine peripheral blood. Liu H et al, BMC Genomics. 2017; 18(1), 479.
  23. Correlation of EGFR or KRAS mutation status with 18F-FDG uptake on PET-CT scan in lung adenocarcinoma. Takamochi K et al, PLoS One. 2017; 12(4), e0175622.
  24. Analysis of the human monocyte-derived macrophage transcriptome and response to lipopolysaccharide provides new insights into genetic aetiology of inflammatory bowel disease. Baillie JK et al, PLoS Genet. 2017; 13(3), e1006641.
  25. A Transcriptional Switch Point During Hematopoietic Stem and Progenitor Cell Ontogeny. Sugiyama D et al, Stem Cells Dev. 2017; 26(5), 314-327.
  26. Update of the FANTOM web resource: high resolution transcriptome of diverse cell types in mammals. Lizio M et al, Nucleic Acids Res. 2017; 45(D1), D737-D743.
  27. Transcriptional Dynamics During Human Adipogenesis and Its Link to Adipose Morphology and Distribution. Ehrlund A et al, Diabetes. 2017; 66(1), 218-230.
2016

  1. Cap Analysis of Gene Expression (CAGE) Sequencing Reveals Alterations of the Transcriptional Signatures of FLT3-ITD with Secondary D835 TKD Mutations in Acute Myeloid Leukemia. Tabe Y et al, Blood. 2016; 128(22), 1530.
  2. Enhanced Identification of Transcriptional Enhancers Provides Mechanistic Insights into Diseases. Murakawa Y et al, Trends Genet. 2016; 32(2), 76-88.
  3. Transcriptome Analysis of Recurrently Deregulated Genes across Multiple Cancers Identifies New Pan-Cancer Biomarkers. Kaczkowski B et al, Cancer Res. 2016; 76(2), 216-226.
  4.     and more

  5. FANTOM5 transcriptome catalog of cellular states based on Semantic MediaWiki. Abugessaisa I et al, Database. 2016; baw105.
  6. YY1 binding association with sex-biased transcription revealed through X-linked transcript levels and allelic binding analyses. Chen CY et al, Sci Rep. 2016; 6, 37324.
  7. Single-Nucleotide Resolution Mapping of Hepatitis B Virus Promoters in Infected Human Livers and Hepatocellular Carcinoma. Altinel K et al, J Virol. 2016; 90(23), 10811-10822.
  8. FARNA: knowledgebase of inferred functions of non-coding RNA transcripts. Alam T et al, Nucleic Acids Res. 2016; 45(5), 2838-2848.
  9. Discriminative identification of transcriptional responses of promoters and enhancers after stimulus. Kleftogiannis D et al, Nucleic Acids Res. 2016; 45(4), e25.
  10. Promoter Architecture and Sex-Specific Gene Expression in Daphnia pulex. Raborn RT et al, Genetics. 2016; 204(2), 593-612.
  11. Transcriptome analysis of periodontitis-associated fibroblasts by CAGE sequencing identified DLX5 and RUNX2 long variant as novel regulators involved in periodontitis. Horie M et al, Sci Rep. 2016; 6, 33666.
  12. Novel biomarkers that assist in accurate discrimination of squamous cell carcinoma from adenocarcinoma of the lung. Takamochi K et al, BMC Cancer. 2016; 16(1), 760.
  13. The rubber tree genome shows expansion of gene family associated with rubber biosynthesis. Lau NS et al, Sci Rep. 2016; 6, 28594.
  14. Optimizing sgRNA position markedly improves the efficiency of CRISPR/dCas9-mediated transcriptional repression. Radzisheuskaya A et al, Nucleic Acids Res. 2016; 44(18), e141.
  15. Comprehensive promoter level expression quantitative trait loci analysis of the human frontal lobe. Blauwendraat C et al, Genome Med. 2016; 8, 65.
  16. CAGEd-oPOSSUM: motif enrichment analysis from CAGE-derived TSSs. Arenillas DJ et al, Bioinformatics. 2016; 32(18), 2858-2860.
  17. DeepCAGE transcriptomics identify HOXD10 as transcription factor regulating lymphatic endothelial responses to VEGF-C. Klein S et al, J Cell Sci. 2016; 129(13), 2573-2585.
  18. Reduced expression of APC-1B but not APC-1A by the deletion of promoter 1B is responsible for familial adenomatous polyposis. Yamaguchi K et al, Sci Rep. 2016; 6, 26011.
  19. nanoCAGE reveals 5' UTR features that define specific modes of translation of functionally related MTOR-sensitive mRNAs. Gandin V et al, Genome Res. 2016; 26(5), 636-648.
  20. The emerging role of noncoding RNA in prostate cancer progression and its implication on diagnosis and treatment. Takayama K et al, Brief Funct Genomics. 2016; 15(3), 257-265.
  21. Transcriptional, epigenetic and retroviral signatures identify regulatory regions involved in hematopoietic lineage commitment. Romano O et al, Sci Rep. 2016; 6, 24724.
  22. Functional annotation of the vlinc class of non-coding RNAs using systems biology approach. St Laurent G et al, Nucleic Acids Res. 2016; 44(7), 3233-3252.
  23. C9orf72 is differentially expressed in the central nervous system and myeloid cells and consistently reduced in C9orf72, MAPT and GRN mutation carriers. Rizzu P et al, Acta Neuropathol Commun. 2016; 4(1), 37.
  24. A predictive computational framework for direct reprogramming between human cell types. Rackham OJ et al, Nat Genet. 2016; 48(3), 331-335.
  25. Large-scale profiling of signalling pathways reveals an asthma specific signature in bronchial smooth muscle cells. Alexandrova E et al, Oncotarget. 2016; 7, 25150-25161.
  26. Expression Specificity of Disease-Associated lncRNAs: Toward Personalized Medicine. Nguyen Q et al, Curr Top Microbiol Immunol. 2016; 394, 237-258.
2015

  1. Transcribed enhancers lead waves of coordinated transcription in transitioning mammalian cells. Arner E et al, Science. 2015; 347(6225), 1010-1014.
  2. CAGE profiling of ncRNAs in hepatocellular carcinoma reveals widespread activation of retroviral LTR promoters in virus-induced tumors. Hashimoto K et al, Genome Res. 2015; 25(12), 1812-1824.
  3. Coexpression networks identify brain region-specific enhancer RNAs in the human brain. Yao P et al, Nat Neurosci. 2015; 18(8), 1168-1174.
  4.     and more

  5. CAGEr: precise TSS data retrieval and high-resolution promoterome mining for integrative analyses. Haberle V et al, Nucleic Acids Res. 2015; 43(8), e51.
  6. Hierarchical folding and reorganization of chromosomes are linked to transcriptional changes in cellular differentiation. Fraser J et al, Mol Syst Biol. 2015; 11(12), 852.
  7. The Constrained Maximal Expression Level Owing to Haploidy Shapes Gene Content on the Mammalian X Chromosome. Hurst LD et al, PLoS Biol. 2015; 13(12), e1002315.
  8. Remodeling of retrotransposon elements during epigenetic induction of adult visual cortical plasticity by HDAC inhibitors. Lennartsson A et al, Epigenetics Chromatin. 2015; 8, 55.
  9. Core Promoter Plasticity Between Maize Tissues and Genotypes Contrasts with Predominance of Sharp Transcription Initiation Sites. Mejía-Guerra MK et al, Plant Cell. 2015; 27(12), 3309-3320.
  10. Application of Gene Expression Trajectories Initiated from ErbB Receptor Activation Highlights the Dynamics of Divergent Promoter Usage. Carbajo D et al, PLoS One. 2015; 10(12), e0144176.
  11. Tor Signaling Regulates Transcription of Amino Acid Permeases through a GATA Transcription Factor Gaf1 in Fission Yeast. Yan M et al, PLoS One. 2015; 10(12), e0144677.
  12. Identification and annotation of conserved promoters and macrophage-expressed genes in the pig genome. Robert C et al, BMC Genomics. 2015; 16(1), 970.
  13. DeepCAGE Transcriptomics Reveal an Important Role of the Transcription Factor MAFB in the Lymphatic Endothelium. Dieterich LC et al, Cell Rep. 2015; 13(7), 1493-1504.
  14. Mapping Mammalian Cell-type-specific Transcriptional Regulatory Networks Using KD-CAGE and ChIP-seq Data in the TC-YIK Cell Line. Lizio M et al, Front Genet. 2015; 6, 331.
  15. The frequent evolutionary birth and death of functional promoters in mouse and human. Young RS et al, Genome Res. 2015; 25(10), 1546-1557.
  16. Paradigm shifts in genomics through the FANTOM projects. de Hoon M et al, Mamm Genome. 2015; 26(9-10), 391-402.
  17. Targeting Batf2 for infectious diseases and cancer. Guler R et al, Oncotarget. 2015; 6(29), 26575-26582.
  18. Redefining the transcriptional regulatory dynamics of classically and alternatively activated macrophages by deepCAGE transcriptomics. Roy S et al, Nucleic Acids Res. 2015; 43(14), 6969-6982.
  19. NanoCAGE-XL and CapFilter: an approach to genome wide identification of high confidence transcription start sites. Cumbie JS et al, BMC Genomics. 2015; 16, 597.
  20. Expression of mouse Dab2ip transcript variants and gene methylation during brain development. Salami F et al, Gene. 2015; 568(1), 19-24.
  21. Complementing tissue characterization by integrating transcriptome profiling from the Human Protein Atlas and from the FANTOM5 consortium. Yu NY et al, Nucleic Acids Res. 2015; 43(14), 6787-6798.
  22. EpiFactors: a comprehensive database of human epigenetic factors and complexes. Medvedeva YA et al, Database. 2015; bav067.
  23. Promoter-level expression clustering identifies time development of transcriptional regulatory cascades initiated by ErbB receptors in breast cancer cells. Mina M et al, Sci Rep. 2015; 5, 11999.
  24. A draft network of ligand-receptor-mediated multicellular signalling in human. Ramilowski JA et al, Nat Commun. 2015; 6, 7866.
  25. Technical Advance: Transcription factor, promoter, and enhancer utilization in human myeloid cells. Joshi A et al, J Leukoc Biol. 2015; 97(5), 985-995.
  26. Retinoic acid potentiates inflammatory cytokines in human mast cells: identification of mast cells as prominent constituents of the skin retinoid network. Babina M et al, Mol Cell Endocrinol. 2015; 406, 49-59.
  27. ElemeNT: a computational tool for detecting core promoter elements. Sloutskin A et al, Transcription. 2015; 6(3), 41-50.
  28. Expression analysis of the long non-coding RNA antisense to Uchl1 (AS Uchl1) during dopaminergic cells' differentiation in vitro and in neurochemical models of Parkinson's disease. Carrieri C et al, Front Cell Neurosci. 2015; 9, 114.
  29. Transcriptional dynamics reveal critical roles for non-coding RNAs in the immediate-early response. Aitken S et al, PLoS Comput Biol. 2015; 11(4), e1004217.
  30. Human endogenous retroviruses sustain complex and cooperative regulation of gene-containing loci and unannotated megabase-sized regions. Sokol M et al, Retrovirology. 2015; 12, 32.
  31. Discovery of molecular markers to discriminate corneal endothelial cells in the human body. Yoshihara M et al, PLoS One. 2015; 10(3), e0117581.
  32. Transcription factor, promoter, and enhancer utilization in human myeloid cells. Joshi A et al, J Leukoc Biol. 2015; 97(5), 985-995.
  33. piPipes: a set of pipelines for piRNA and transposon analysis via small RNA-seq, RNA-seq, degradome- and CAGE-seq, ChIP-seq and genomic DNA sequencing. Han BW et al, Bioinformatics. 2015; 31(4), 593-595.
  34. Characterization of Novel Transcripts of Human Papillomavirus Type 16 Using Cap Analysis Gene Expression Technology. Taguchi A et al, Journal of Virology. 2015; 89(4), 2448-2452.
  35. Nuclear transcriptome profiling of induced pluripotent stem cells and embryonic stem cells identify noncoding loci resistant to reprogramming. Fort A et al, Cell Cycle. 2015; 14(8), 1148-1155.
  36. The statistical geometry of transcriptome divergence in cell-type evolution and cancer. Liang C et al, Nat Commun. 2015; 6, 6066.
  37. Gateways to the FANTOM5 promoter level mammalian expression atlas. Lizio M et al, Genome Biol. 2015; 16, 22.
2014

  1. An atlas of active enhancers across human cell types and tissues. Andersson R et al, Nature. 2014; 507(7493), 455-461.
  2. A promoter level mammalian expression atlas. FANTOM Consortium et al, Nature. 2014; 507(7493), 462-470.
  3. Two independent transcription initiation codes overlap on vertebrate core promoters. Haberle V et al, Nature. 2014; 507(7492), 381-385.
  4.     and more

  5. Detecting expressed genes using CAGE. Murata M et al, Methods Mol Biol. 2014; 1164, 67-85.
  6. RECLU: a pipeline to discover reproducible transcriptional start sites and their alternative regulation using capped analysis of gene expression (CAGE). Ohmiya H et al, BMC Genomics. 2014; 15, 269.
  7. Understanding Epistatic Interactions between Genes Targeted by Non-coding Regulatory Elements in Complex Diseases. Sung MK et al, Genomics Inform. 2014; 12(4), 181-186.
  8. CAGE-defined promoter regions of the genes implicated in Rett Syndrome. Vitezic M et al, BMC Genomics. 2014; 15, 1177.
  9. Specific mesothelial signature marks the heterogeneity of mesenchymal stem cells from high-grade serous ovarian cancer. Verardo R et al, Stem Cells. 2014; 32(11), 2998-3011.
  10. Retinal transcriptome profiling at transcription start sites: a cap analysis of gene expression early after axonal injury. Yasuda M et al, BMC Genomics. 2014; 15, 982.
  11. Mesencephalic dopaminergic neurons express a repertoire of olfactory receptors and respond to odorant-like molecules. Grison A et al, BMC Genomics. 2014; 15, 729.
  12. Mast cell transcriptome elucidation: what are the implications for allergic disease in the clinic and where do we go next? Babina M et al, Expert Rev Clin Immunol. 2014; 10(8), 977-980.
  13. Integrating epigenetic marks for identification of transcriptionally active miRNAs. Xiao Y et al, Genomics. 2014; 104(2), 70-78.
  14. A transient disruption of fibroblastic transcriptional regulatory network facilitates trans-differentiation. Tomaru Y et al, Nucleic Acids Res. 2014; 42(14), 8905-8913.
  15. A simple metric of promoter architecture robustly predicts expression breadth of human genes suggesting that most transcription factors are positive regulators. Hurst LD et al, Genome Biol. 2014; 15(7), 413.
  16. CCL2 enhances pluripotency of human induced pluripotent stem cells by activating hypoxia related genes. Hasegawa Y et al, Sci Rep. 2014; 4, 5228.
  17. The evolution of human cells in terms of protein innovation. Sardar AJ et al, Mol Biol Evol. 2014; 31(6), 1364-1374.
  18. Deep transcriptome profiling of mammalian stem cells supports a regulatory role for retrotransposons in pluripotency maintenance. Fort A et al, Nat Genet. 2014; 46(6), 558-566.
  19. Systemic identification of estrogen-regulated genes in breast cancer cells through cap analysis of gene expression mapping. Yamaga R et al, Biochem Biophys Res Commun. 2014; 447(3), 531-536.
  20. MOIRAI: a compact workflow system for CAGE analysis. Hasegawa A et al, BMC Bioinformatics. 2014; 15, 144.
  21. Genomics: a catalogue of human gene activity. Lokody I et al, Nat Rev Genet. 2014; 15(5), 290.
  22. Transcriptional profiling of the human fibrillin/LTBP gene family, key regulators of mesenchymal cell functions. Davis MR et al, Mol Gen Metab. 2014; 112(1), 73-83.
  23. Transcription and enhancer profiling in human monocyte subsets. Schmidl C et al, Blood. 2014; 123(17), e90-99.
  24. The enhancer and promoter landscape of human regulatory and conventional T cell subpopulations. Schmidl C et al, Blood. 2014; 123(17), e68-e78.
  25. Redefinition of the human mast cell transcriptome by deep-CAGE sequencing. Motakis E et al, Blood. 2014; 123(17), e58-e67.
  26. High-throughput transcription profiling identifies putative epigenetic regulators of hematopoiesis. Prasad P et al, Blood. 2014; 123(17), e46-e57.
  27. Explaining the correlations among properties of mammalian promoters. Frith MC et al, Nucleic Acids Res. 2014; 42(8), 4823-4832.
  28. Deep sequencing blood transcriptomes. Forrest AR et al, Blood. 2014; 123(17), 2595-2596.
  29. Comparison of CAGE and RNA-seq transcriptome profiling using a clonally amplified and single molecule next generation sequencing. Kawaji H et al, Genome Res. 2014; 24(4), 708-717.
  30. Analysis of the DNA methylome and transcriptome in granulopoiesis reveals timed changes and dynamic enhancer methylation. Rönnerblad M et al, Blood. 2014; 123(17), e79-e89.
  31. Differential roles of epigenetic changes and Foxp3 expression in regulatory T cell-specific transcriptional regulation. Morikawa H et al, Proc Natl Acad Sci U S A. 2014; 111(14), 5289-5294.
  32. Ceruloplasmin is a novel adipokine which is overexpressed in adipose tissue of obese subjects and in obesity-associated cancer cells. Arner E et al, PLoS One. 2014; 9(3), e80274.
  33. Effects of cytosine methylation on transcription factor binding sites. Medvedeva YA et al, BMC Genomics. 2014; 15, 119.
  34. Interactive visualization and analysis of large-scale NGS data-sets using ZENBU. Severin J et al, Nat Biotechnol. 2014; 32(3), 217-219.
  35. Chromatin states reveal functional associations for globally defined transcription start sites in four human cell lines. Rye M et al, BMC Genomics. 2014; 15, 120.
  36. CAGExploreR: an R package for the analysis and visualization of promoter dynamics across multiple experiments. Dimont E et al, Bioinformatics. 2014; 30(8), 1183-1184.
  37. NanoCAGE analysis of the mouse olfactory epithelium identifies the expression of vomeronasal receptors and of proximal LINE elements. Pascarella G et al, Front Cell Neurosci. 2014; 8, 41.
2013

2012

2011

2010

2010
  1. Building promoter aware transcriptional regulatory networks using siRNA perturbation and deepCAGE. Vitezic M et al, Nucleic Acids Res. 2010; 38(22), 8141-8148.
  2. Linking promoters to functional transcripts in small samples with nanoCAGE and CAGEscan. Plessy C et al, Nat Methods. 2010; 7(7), 528-534.
  3. An atlas of combinatorial transcriptional regulation in mouse and man. Ravasi T et al, Cell. 2010; 140(5), 744-752.
  4. High sensitivity TSS prediction: estimates of locations where TSS cannot occur. Schaefer U et al, PLoS One. 2010; 5(11), e13934.
  5. Tissue-specific transcript annotation and expression profiling with complementary next-generation sequencing technologies. Hestand MS et al, Nucleic Acids Res. 2010; 38(16), e165.
  6. The combination of gene perturbation assay and ChIP-chip reveals functional direct target genes for IRF8 in THP-1 cells. Kubosaki A et al, Mol Immunol. 2010; 47(14), 2295-2302.
  7. The genome sequence of the spontaneously hypertensive rat: Analysis and functional significance. Atanur SS et al, Genome Res. 2010; 20(6), 791-803.
  8. Core promoter structure and genomic context reflect histone 3 lysine 9 acetylation patterns. Kratz A et al, BMC Genomics. 2010; 11, 257.
  9. Cross-mapping and the identification of editing sites in mature microRNAs in high-throughput sequencing libraries. de Hoon MJ et al, Genome Res. 2010; 20(2), 257-264.
  10. Induction of microRNAs, mir-155, mir-222, mir-424 and mir-503, promotes monocytic differentiation through combinatorial regulation. Forrest AR et al, Leukemia. 2010; 24(2), 460-466.
2009

2009
  1. The FANTOM web resource: from mammalian transcriptional landscape to its dynamic regulation. Kawaji H et al, Genome Biol. 2009; 10(4), R40.
  2. Deciphering the transcriptional circuitry of microRNA genes expressed during human monocytic differentiation. Schmeier S et al, BMC Genomics. 2009; 10, 595.
  3. Development of a high-throughput method for the systematic identification of human proteins nuclear translocation potential. Hoat TX et al, BMC Cell Biol. 2009; 10, 69.
  4. MiR-107 and MiR-185 can induce cell cycle arrest in human non small cell lung cancer cell lines. Takahashi Y et al, PLoS One. 2009; 4(8), e6677.
  5. High-resolution analysis of aberrant regions in autosomal chromosomes in human leukemia THP-1 cell line. Adati N et al, BMC Res Notes. 2009; 2, 153.
  6. Regulatory interdependence of myeloid transcription factors revealed by Matrix RNAi analysis. Tomaru Y et al, Genome Biol. 2009; 10(11), R121.
  7. SDRF2GRAPH: a visualization tool of a spreadsheet-based description of experimental processes. Kawaji H et al, BMC Bioinformatics. 2009; 10, 133.
  8. Tiny RNAs associated with transcription start sites in animals. Taft RJ et al, Nat Genet. 2009; 41(5), 572-578.
  9. The transcriptional network that controls growth arrest and differentiation in a human myeloid leukemia cell line. FANTOM Consortium et al, Nat Genet. 2009; 41(5), 553-562.
  10. The regulated retrotransposon transcriptome of mammalian cells. Faulkner GJ et al, Nat Genet. 2009; 41(5), 563-571.
  11. Data-driven normalization strategies for high-throughput quantitative RT-PCR. Mar JC et al, BMC Bioinformatics. 2009; 10, 110.
  12. A transcription factor affinity-based code for mammalian transcription initiation. Megraw M et al, Genome Res. 2009; 19(4), 644-656.
  13. Chromatin conformation signatures of cellular differentiation. Fraser J et al, Genome Biol. 2009; 10(4), R37.
  14. Transcriptional features of genomic regulatory blocks. Akalin A et al, Genome Biol. 2009; 10(4), R38.
  15. FANTOM4 EdgeExpressDB: an integrated database of promoters, genes, microRNAs, expression dynamics and regulatory interactions. Severin J et al, Genome Biol. 2009; 10(4), R39.
  16. Genome-wide detection and analysis of hippocampus core promoters using DeepCAGE. Valen E et al, Genome Res. 2009; 19(2), 255-265.
  17. Genome-wide investigation of in vivo EGR-1 binding sites in monocytic differentiation. Kubosaki A et al, Genome Biol. 2009; 10(4), R41.
  18. Methods for analyzing deep sequencing expression data: constructing the human and mouse promoterome with deepCAGE data. Balwierz PJ et al, Genome Biol. 2009; 10(7), R79.
2008

2007

2006

2006
  1. CAGE: cap analysis of gene expression. Kodzius R et al, Nat Methods. 2006; 3(3), 211-222.
  2. The complexity of the mammalian transcriptome. Gustincich S et al, J Physiol. 2006; 575(Pt2), 321-332.
  3. Tagging mammalian transcription complexity. Carninci P et al, Trends Genet. 2006; 22(9), 501-510.
  4. Large-scale correlation of DNA accession numbers to the cDNAs in the FANTOM full-length mouse cDNA clone set. Ajioka I et al, Keio J Med. 2006; 55(3), 107-110.
  5. Transcriptional network dynamics in macrophage activation. Nilsson R et al, Genomics. 2006; 88(2), 133-142.
  6. Genome-wide analysis of mammalian promoter architecture and evolution. Carninci P et al, Nat Genet. 2006; 38(6), 626-635.
  7. Dynamic usage of transcription start sites within core promoters. Kawaji H et al, Genome Biol. 2006; 7(12), R118.
  8. Subcellular localization of mammalian type II membrane proteins. Aturaliya RN et al, Traffic. 2006; 7(5), 613-625.
  9. Transcript annotation in FANTOM3: mouse gene catalog based on physical cDNAs. Maeda N et al, PLoS Genet. 2006; 2(4), e62.
  10. The abundance of short proteins in the mammalian proteome. Frith MC et al, PLoS Genet. 2006; 2(4), e52.
  11. Pseudo-messenger RNA: phantoms of the transcriptome. Frith MC et al, PLoS Genet. 2006; 2(4), e23.
  12. Mice and men: their promoter properties. Bajic VB et al, PLoS Genet. 2006; 2(4), e54.
  13. Heterotachy in mammalian promoter evolution. Taylor MS et al, PLoS Genet. 2006; 2(4), e30.
  14. Genome Network and FANTOM3: assessing the complexity of the transcriptome. Hayashizaki Y et al, PLoS Genet. 2006; 2(4), e63.
  15. Distinguishing protein-coding from non-coding RNAs through support vector machines. Liu J et al, PLoS Genet. 2006; 2(4), e29.
  16. Differential use of signal peptides and membrane domains is a common occurrence in the protein output of transcriptional units. Davis MJ et al, PLoS Genet. 2006; 2(4), e46.
  17. Complex Loci in human and mouse genomes. Engström PG et al, PLoS Genet. 2006; 2(4), e47.
  18. Clusters of internally primed transcripts reveal novel long noncoding RNAs. Furuno M et al, PLoS Genet. 2006; 2(4), e37.
  19. A simple physical model predicts small exon length variations. Chern TM et al, PLoS Genet. 2006; 2(4), e45.
  20. A method for similarity search of genomic positional expression using CAGE. Seno S et al, PLoS Genet. 2006; 2(4), e44.
  21. Discrimination of non-protein-coding transcripts from protein-coding mRNA. Frith MC et al, RNA Biol. 2006; 3(1), 40-48.
  22. CAGE Basic/Analysis Databases: the CAGE resource for comprehensive promoter analysis. Kawaji H et al, Nucleic Acids Res. 2006; 34(Database issue), D632-D636.
  23. Genome-wide review of transcriptional complexity in mouse protein kinases and phosphatases. Forrest AR et al, Genome Biol. 2006; 7(1), R5.
  24. Alternate transcription of the Toll-like receptor signaling cascade. Wells CA et al, Genome Biol. 2006; 7(2), R10.
2005

2004

2003

2003
  1. Cap analysis gene expression for high-throughput analysis of transcriptional starting point and identification of promoter usage. Shiraki T et al, Proc Natl Acad Sci U S A. 2003; 100(26), 15776-15781.
  2. Subtraction of cap-trapped full-length cDNA libraries to select rare transcripts. Hirozane-Kishikawa T et al, Biotechniques. 2003; 35(3), 510-6, 518.
  3. The mouse secretome: functional classification of the proteins secreted into the extracellular environment. Grimmond SM et al, Genome Res. 2003; 13(6B), 1350-1359.
  4. The mammalian protein-protein interaction database and its viewing system that is linked to the main FANTOM2 viewer. Suzuki H et al, Genome Res. 2003; 13(6B), 1534-1541.
  5. The comparative proteomics of ubiquitination in mouse. Semple CA et al, Genome Res. 2003; 13(6B), 1389-1394.
  6. Targeting a complex transcriptome: the construction of the mouse full-length cDNA encyclopedia. Carninci P et al, Genome Res. 2003; 13(6B), 1273-1289.
  7. Systematic expression profiling of the mouse transcriptome using RIKEN cDNA microarrays. Bono H et al, Genome Res. 2003; 13(6B), 1318-1323.
  8. Systematic characterization of the zinc-finger-containing proteins in the mouse transcriptome. Ravasi T et al, Genome Res. 2003; 13(6B), 1430-1442.
  9. Phosphoregulators: protein kinases and protein phosphatases of mouse. Forrest AR et al, Genome Res. 2003; 13(6B), 1443-1454.
  10. Mouse proteome analysis. Kanapin A et al, Genome Res. 2003; 13(6B), 1335-1344.
  11. Kinesin superfamily proteins (KIFs) in the mouse transcriptome. Miki H et al, Genome Res. 2003; 13(6B), 1455-1465.
  12. Inferring higher functional information for RIKEN mouse full-length cDNA clones with FACTS. Nagashima T et al, Genome Res. 2003; 13(6B), 1520-1533.
  13. Impact of Alternative Initiation, Splicing, and Termination on the Diversity of the mRNA Transcripts Encoded by the Mouse Transcriptome. Zavolan M et al, Genome Res. 2003; 13(6B), 1290-1300.
  14. Identification of putative noncoding RNAs among the RIKEN mouse full-length cDNA collection. Numata K et al, Genome Res. 2003; 13(6B), 1301-1306.
  15. Identification and analysis of chromodomain-containing proteins encoded in the mouse transcriptome. Tajul-Arifin K et al, Genome Res. 2003; 13(6B), 1416-1429.
  16. Human disease genes and their cloned mouse orthologs: exploration of the FANTOM2 cDNA sequence data set. Schriml LM et al, Genome Res. 2003; 13(6B), 1496-1500.
  17. GeneLynx mouse: integrated portal to the mouse genome. Lenhard B et al, Genome Res. 2003; 13(6B), 1501-1504.
  18. Exploration of the cell-cycle genes found within the RIKEN FANTOM2 data set. Forrest AR et al, Genome Res. 2003; 13(6B), 1366-1375.
  19. Discovery of imprinted transcripts in the mouse transcriptome using large-scale expression profiling. Nikaido I et al, Genome Res. 2003; 13(6B), 1402-1409.
  20. Development and evaluation of an automated annotation pipeline and cDNA annotation system. Kasukawa T et al, Genome Res. 2003; 13(6B), 1542-1551.
  21. Cytokine-related genes identified from the RIKEN full-length mouse cDNA data set. Brusic V et al, Genome Res. 2003; 13(6B), 1307-1317.
  22. Continued discovery of transcriptional units expressed in cells of the mouse mononuclear phagocyte lineage. Wells CA et al, Genome Res. 2003; 13(6B), 1360-1365.
  23. Connecting sequence and biology in the laboratory mouse. Baldarelli RM et al, Genome Res. 2003; 13(6B), 1505-1519.
  24. Comprehensive analysis of the mouse metabolome based on the transcriptome. Bono H et al, Genome Res. 2003; 13(6B), 1345-1349.
  25. Comparative analysis of apoptosis and inflammation genes of mice and humans. Reed JC et al, Genome Res. 2003; 13(6B), 1376-1388.
  26. CDS annotation in full-length cDNA sequence. Furuno M et al, Genome Res. 2003; 13(6B), 1478-1487.
  27. Antisense transcripts with FANTOM2 clone set and their implications for gene regulation. Kiyosawa H et al, Genome Res. 2003; 13(6B), 1324-1334.
  28. Analysis of the mouse transcriptome for genes involved in the function of the nervous system. Gustincich S et al, Genome Res. 2003; 13(6B), 1395-1401.
  29. A comprehensive transcript map of the mouse Gnas imprinted complex. Holmes R et al, Genome Res. 2003; 13(6B), 1410-1415.
  30. G protein-coupled receptor genes in the FANTOM2 database. Kawasawa Y et al, Genome Res. 2003; 13(6B), 1466-1477.
2002

2001

2000

1999

1998

1997

1996